tecznotes
Michal Migurski's notebook, listening post, and soapbox. Subscribe to ![]() this blog.
Check out the rest of my site as well.
this blog.
Check out the rest of my site as well.
Jan 23, 2013 1:55am
week 1,836: back at shiny
Last week I announced my departure and many friends said nice, encouraging things on Twitter and here. Thank you. I’m sort of leaping into the abyss here, and it makes a huge difference to know I’m not just twisting in the wind.
Chicago and Denver were both cold and fun. I attended Chris Helm, Steve Citron-Pousty and Brian Timoney’s event JS.Geo. Peter Batty has a complete writeup, which doesn’t quite do justice to the absolute ubiquity of D3 at the conference. It was a good opportunity for me to finally/again get my head straight with D3 data joins with Seth and Aaron Ogle. I remain convinced that as D3’s primary feature, this is sadly under-documented. In Denver, my mustache repeatedly iced over. In Chicago, less so but it was still pretty cold.

I’m back now, and picking up a few projects.
Green Means Go is due for some thinking about individual counties. I’d like to create a single, printable view for each of 3000+ counties with some information about OSM coverage attached.
I’m starting to look at tiled data, D3 and WebGL together for the Nokia WebGL Maps. I’m super excited about the possibilities of shaders here, and need to get my head around tile-like loading of linear ArrayBuffers.
The Metro Extracts are overdue for an update, and I’d like to start doing these more regularly using OSM-US Foundation hardware. Some recent interest in the project suggests that I’ve been paying too little attention to it.
Some small potential consulting gigs, and general future planning.


Jan 15, 2013 7:34am
week 1,835: leaving stamen

I am in Denver. Wednesday I will be in Chicago. Friday night I will be back in Oakland. Here, I am visiting JS.Geo conference catching up on all the Javascript map-making I’ve missed over the years. In Chicago, I hope to meet with folks from the campaign now that it’s all over, and some new people.

On the last day of Baktun 13 of the Classical Mayan calendar, we held our annual holiday party. The next morning, we pushed the couches into the big room with the projector, screen and speakers, and spent most of a workday watching season three of Arrested Development and snacking on popcorn and lunch from Pancho Villa. It was the last day of the year, and my final day at Stamen.

Leaving is difficult. I’ve worked with Stamen and Eric Rodenbeck in particular for nine years. I’m sad to not be able to spend much time with new Stamens Mike Tahani and Beth Schechter, and I’m over the moon that Eric and Shawn have brought on Seth Fitzsimmons as my successor. Seth’s worked with us on projects in the past, knows us from the old office, and will fit right in.
In retrospect I’m shocked at how young I was when I joined. I’ve learned firsthand how a world-class design studio is run from one of the best creative directors in the industry, instigated, participated in or merely watched innumerable high-profile public research and client projects, and I’m proud to have seen us grow to a position of prominence and respect in the public’s perception of art and data. The work has never not been good, and my colleagues from over the years are some of my closest friends.

Still, nine years is a long-ass time.
It was like graduate school, art school, and business school all rolled into one and I feel ready to explore in some new directions. For the moment, that means catching up on things: sleep, books, hacking and design projects, exercise, regular blogging, and more. Soon, it will mean looking at new possibilities. For the moment, I don’t know what awaits me in the after but if you’re up for lunch I’m probably game.

Jan 9, 2013 2:55am
work in progress: green means go
Since State Of The Map in Portland, I’ve been applying simple raster methods to OpenStreetMap data to draw a picture of the current state of U.S. Government TIGER/Line data in the project. TIGER data is a street-level dataset of widely varying quality covering the whole of the United States, and much of OSM in this country is built on TIGER. OSM US Board member Martijn Van Exel explains, in his TIGER deserts post:
Back in 2007, we imported TIGER/Line data from the U.S. Census into OpenStreetMap. TIGER/Line was and is pretty crappy geodata, never meant to make pretty maps with, let alone do frivolous things like routing. But we did it anyway, because it gave us more or less complete base data for the U.S. to work with. …there’s lots of places where we haven’t been taking as good care of the data. Vast expanses of U.S. territory where the majority of the data in OSM is still TIGER as it was imported all those years ago. The TIGER deserts.
TIGER data has been a fantastic leg up for the U.S. map, but elsewhere in the world data imports are frowned upon. The german community in particular feels that imports are antithetical to local community mapping. The U.S. is very different from Europe in terms of population density and driving distances. As Toby Murray said in this message last year, the imbalance between mapper population and surface area between Kansas and Germany is potentially insurmountable:
It is a 9 hour drive from Topeka to Denver and I think you go past a total of 3 cities with a population of over 10,000. In fact, out of the 54 counties west of Wichita, only 7 have a population for the whole county of over 10,000. So while we might be able to start OSM communities in some of the larger cities, vast stretches of the country would remain completely empty.
In many rural parts of the country, the prospective local OSM mapping population and the creators of government data are exactly the same people. I talked to an Esri employee at SOTM this year who told me that at every year's User Conference, she gets a regular stream of these folks approaching her with data in hand, asking how they can get it into OSM. They are the local community we want, and it’s not always clear how we can help them help us.
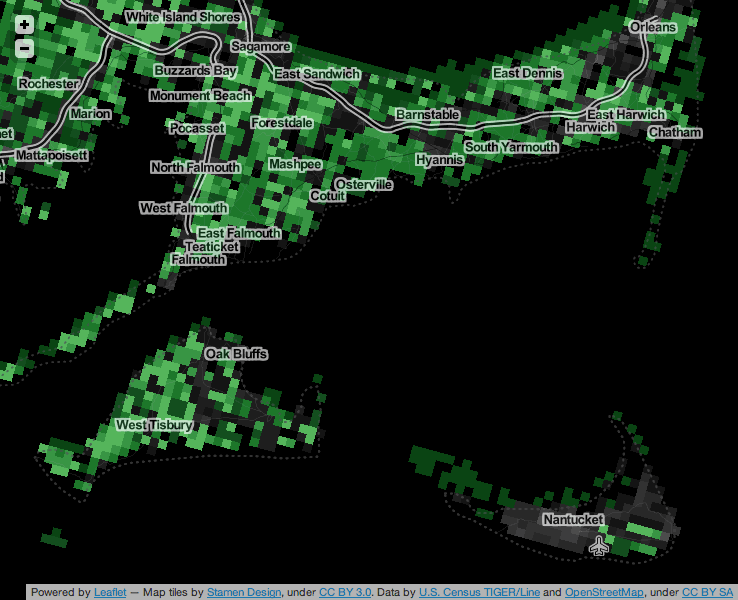
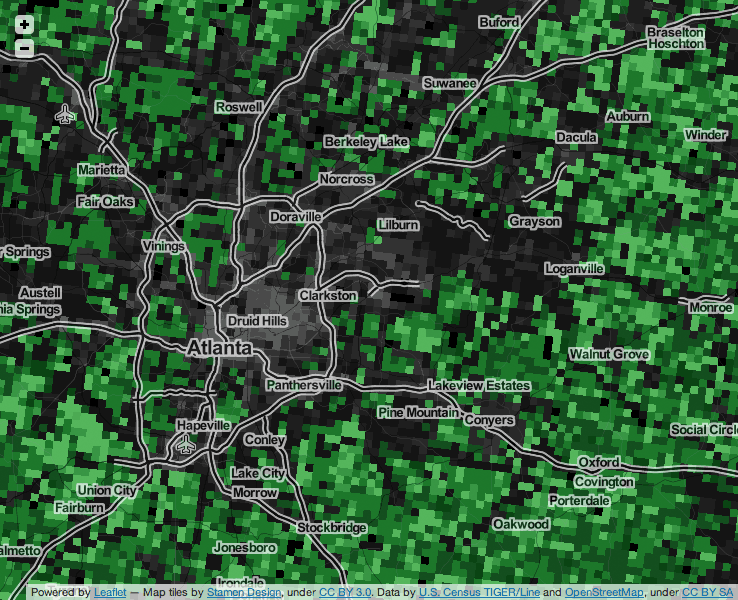
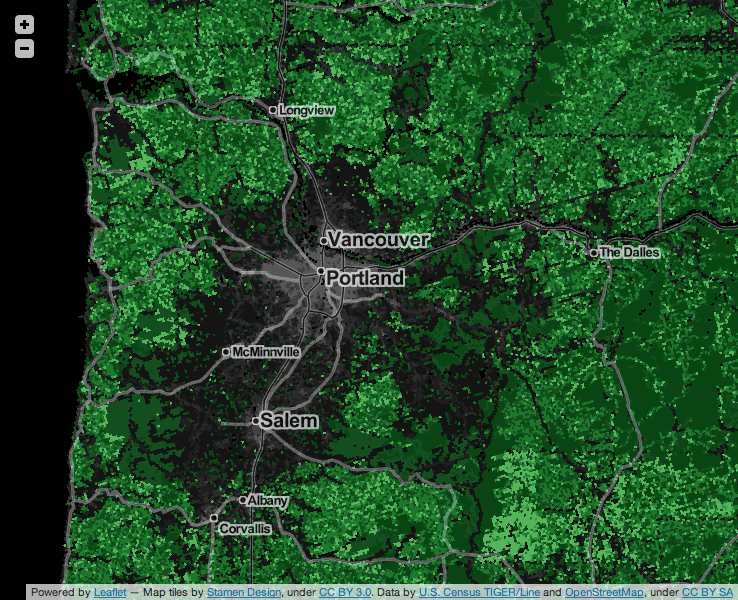
Based on the full history dump, I’ve been working on a map that I’m calling “Green Means Go,” a visualization of the state of TIGER/Line data in OpenStreetMap. The map shows a grid of 1km×1km squares covering the continental United States. Green squares show places where data imports are unlikely to interfere with community mapping, based on a count of unique participating mappers who don’t appear to be part of any of the three big TIGER imports.
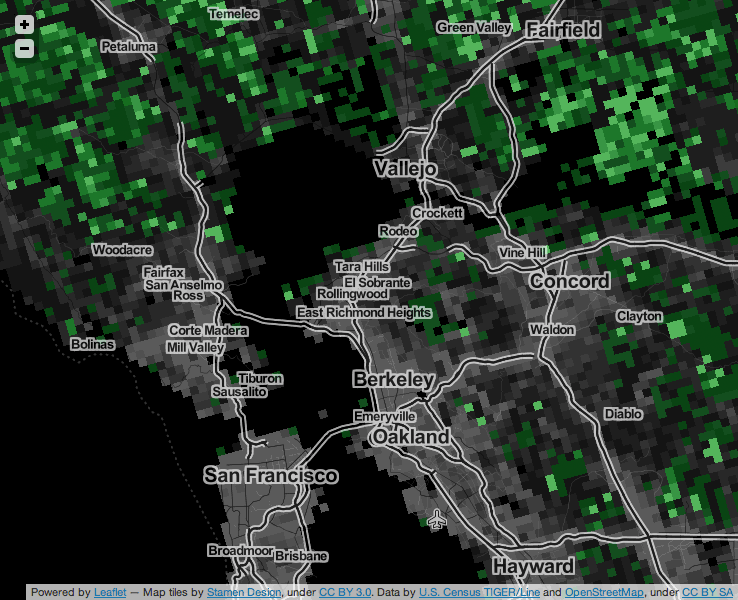
Large, densely-populated urban areas show a similar pattern, with a dark center where many individual mappers have contributed, surrounded by a green rural fringe where no OSM community members have participated in the cleanup and checking of TIGER data.
This pattern shows a lot of local variety. For example, the area around Portland and Salem in Oregon, where we held last year’s SOTM-US conference, shows a broad swath of edited area. Portland in particular has shown a strong local uptake of OSM, basing its official TriMet trip planner on OpenStreetMap.
Other parts of the country, especially in the Great Plains, show the pattern of relative non-participation described by Toby Murray:

Good data does exist in these places, and in fact can be found in the more recent TIGER data sets which rely much more heavily on data generated directly by local county officials. In an area like the one above, the Green Means Go map should help a GIS data owner see that his or her own data and local knowledge would interfere minimally (if at all) with local community mappers.
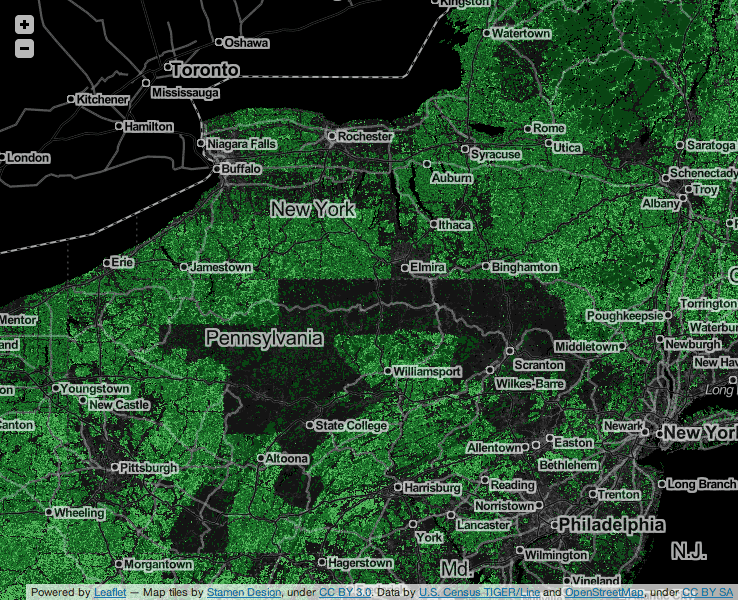
In some cases, we see patterns that are worth exploring further. Entire counties in Pennsylvania show up as edited, but it’s not obvious to me that there is a county-wide local community here. Have these areas already been replaced by county-level importers who’ve improved the data, or is there some portion of the 2007 TIGER import that I’m missing?
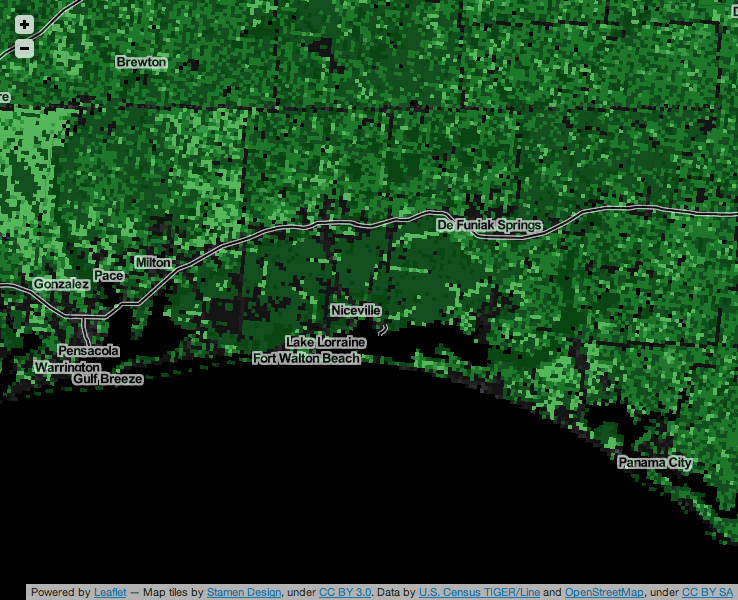
In this other image, the relative lack of any kind of data (OSM or TIGER) is visible on the grounds of Eglin Air Force Base, south of Interstate 10 and east of Pensacola in Florida:
This work is heavily in progress. I’d also like to write about the process of making it, using the National Landcover Dataset and Hadoop to generate this imagery. Some possible next steps include:
- Collaborating with Ian Dees, Alex Barth, Ruben Mendoza and others from the US OSM community to develop better ways of seeing TIGER data.
- Creating static, per-County and Census Place views.
- Developing a plan to regenerate these map tiles for future data updates.
Jan 7, 2013 12:31am
loading artifacts, google maps for iOS
The new GMaps for iOS uses the same/similar vector loading process as its longtime Android counterpart. The high-res stuff, including buildings and tiny streets, looks like it comes in right at zoom level 16, which is about where I would’ve put it given the choice.


The transition between zooms is a bit odd. I would not have expected the difference in street widths between the loaded and unloaded sections here. OpenGL does how (as far as I know) have its own concepts like round line caps or joins, so maybe there’s some client-side buffering these that’s expensive to run more than once per geometry load? The “hot dog” street endings show that each tile’s worth of geometry data comes clipped; I haven’t tested to see whether street names straddle z16 tile boundaries or not.


Interestingly, GMaps makes no attempt to model elevated freeways, terrain, or anything else vertical beyond buildings. In use, this feels like a satisfactory compromise. The road names here are in perspective, applied to the ground as textures, while the route numbers are all billboards facing forward.

I’m not sure why the Grand Avenue label below is not tilted back like Elita or Perkins.

The translucent handling of the building is very good. It’s sketchy enough that you can recognize them and navigate without being distracted by their incompleteness.
Jan 5, 2013 7:53am
blog all oft-played tracks IV
This music:
- made its way to iTunes in 2012,
- and got listened to a lot.
I’ve made these for the past three years, lately. Also: everything as an .m3u playlist.
1. Goto80 and Raquel Meyers: Echidna, Moder Till Alla Monster

Do not miss the associated videos, 2sleep1.
2. Calvin-Harris: I Am Not Alone, Deadmau5 Remix

Sort of a stand-in for the entire remix collection by Deadmau5, on par with the Jesper Dahlbäck remixes. Also good is the Tiny Dancer remake.
3. VCMG: Spock

“VCMG” = Vince Clarke and Martin Gore, they of Depeche Mode making techno. Thanks Tomas for this recommendation.
4. Vitalic: Terminator Benelux

5. Operator: Midnight Star, Vocal LP Version

6. Orbital: The End Of The World

Orbital made a new album this year, and it’s good!
7. Yaz: Situation

8. Skinny Puppy: Assimilate, Live Amphi Festival 2010

This performance of 1984’s Assimilate has a harsher, more sawtooth wave timbre to it that I like very much.
9. Rihanna: SOS

10. Public Enemy: Harder Than You Think

This song crept onto the list in just the past few weeks, and it’s been on regular rotation in our house for weeks.
subscribe to ![]() this site.
|
contact Michal Migurski
this site.
|
contact Michal Migurski